It was a strange sight—twenty three fifth graders forming several head-to-toe lines as they stretched out on the playground. Although it looked like a game, these students were actually taking an abstract concept and translating it into concrete (pardon the pun!) terms.
Teacher Laura Grimm had been teaching the concept of data representation through graphing. A variety of examples had been provided indoors through books and other media. But just looking at examples and doing an occasional worksheet was only part of the instructional design. Laura wanted her students to also experience the concept. The playground provided a perfect venue for using the outdoors as a teaching tool.
Students grouped themselves according to birth month. Signs had been placed on the ground for the twelve months so students found the correct month and stretched out to form their head-to-toe lines on the pavement. The activity visually verified that most students in this year’s class were born in August.
As an extension activity, Laura has kids line up according to birthdates. The long line is closed to form a circle on the blacktop. She then draws lines on the ground to show where the four seasons would fall and an instant circle graph/pie chart is created.
Although students had fun with the activities, there also was a subtle learning process taking place. Abstract concepts like “data representation”, “bar graph” and “circle graph” suddenly take on new meanings as students experience these ideas rather than only read about them. After you have been a part of a living bar graph you definitely have a stronger perception of the concept!
I want to emphasize that the indoor instruction that took place prior to going outside was just as important as the outdoor experience. It was very helpful for students to hear about the abstract concepts first, and then have the clarifying activity outside. Another variation could have been to do the outdoor activity first as an advanced organizer or motivator, and then do the indoor instruction. My preference with this content, though, would be to frontload the abstractions and then use the outdoors to provide clarity.
This activity is a great example of how the outdoors can be used as a venue for instruction, not just as a source of content. We often think that going outside has to mean doing some type of analysis or investigation of nature. Although that’s certainly a valid use of the schoolyard, often going outside can provide a motivating change of pace and place just because we are in a different venue. The change of place can revitalize and refocus activities that have become overly routine indoors. Reading a story, having a class discussion or even practicing spelling words (with sidewalk chalk) are often approached with renewed energy and focus simply because of the outdoor venue.

The concept of a bar graph becomes very real!
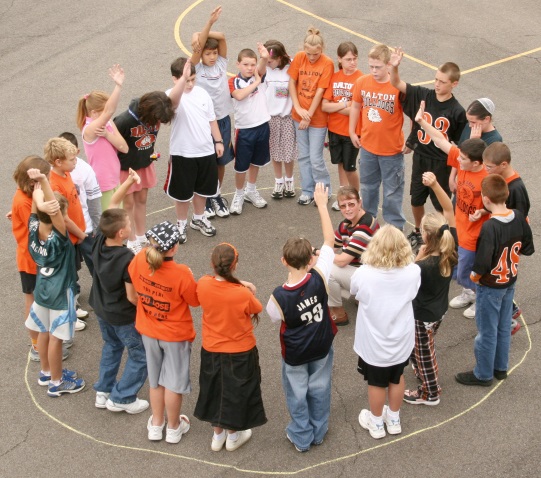
Students line up around the circle by birth month.

Chalk lines show the four seasons in a year.
Outdoor activities do not have to be lengthy. In the human bar graph example described above, Laura’s class was outside for only about 15-20 minutes. I feel strongly that the best use of the school grounds for instruction is to take students outside briefly to re-focus on a specific concept that is currently being developed indoors. The brief outdoor activity gives a change of pace and place and provides an opportunity to approach the concept from an experiential perspective.
Copyright © 2014 by Herb Broda
